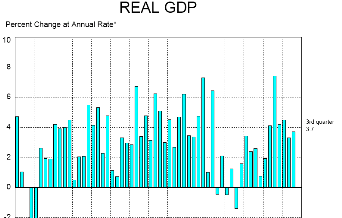
The first two quarters of 1990, for example, shows a decrease in the rate of growth of real GDP, but not a decrease in real GDP.
The four phases of the business cycle are defined in terms of changes in GDP.
- A recession is generally defined as two or more consecutive quarters of declining GDP.
- A trough is a phase where the decline in GDP is ending and a recovery is about to begin.
- A recovery is a period of increasing GDP.
- A peak is a phase where the increase in GDP is ending and a recession is about to begin.
Miscellaneous Notes:
The CPI graph also shows percentage change in CPI, rather than absolute CPI numbers.
For those of you who have spent the last four years in a stupor, the first Bush (43) administration began in January of 2001.
You can adjust these receipts for inflation by comparing any of them to any one year. For example, you could adjust all the later movies to 1977 numbers to match the original Star Wars movie. Or you could convert all of the earlier movies to 2002 numbers.