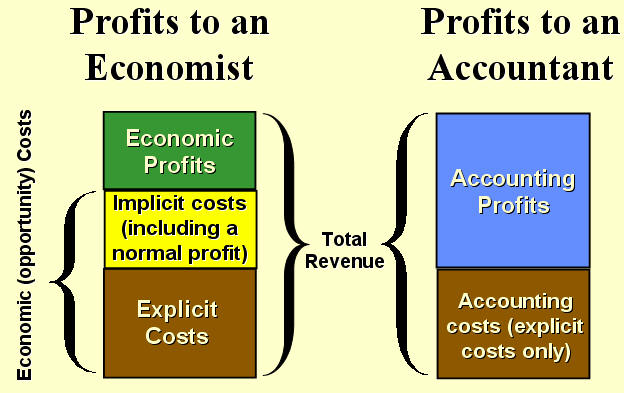
Accounting Profit vs. Economic Profit:
Average vs. Marginal vs. Total cost: (click graph for a larger image)
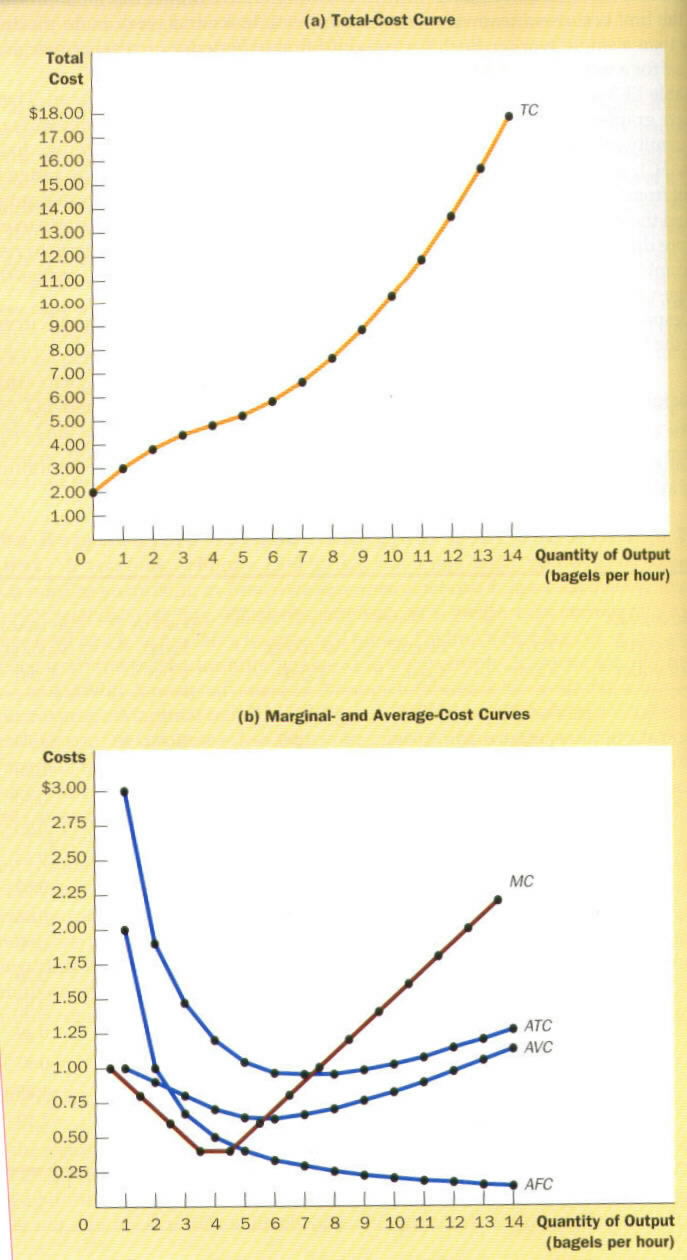
This is a total cost graph. It shows increasing returns up to about 4.5 (the slope is decreasing), and then decreasing returns after that point (the slope is increasing).
The MC (Marginal Cost) curve is the slope of the total cost curve, so it bottoms out where the area of increasing returns ends (about 4.5).
Notice that the MC curve cuts through the very bottom of the ATC (Average Total Cost) and AVC (Average Variable Cost) curves. This is because as long as the addition to cost (MC) is lower than the average, the average must be falling. Conversely, if the MC is greater than average, the average must be increasing.
The vertical distance between the ATC and AVC curves is AFC. That's because TC-VC=FC and therefore ATC-AVC=AFC.
Marginal/Total Utility relationship:
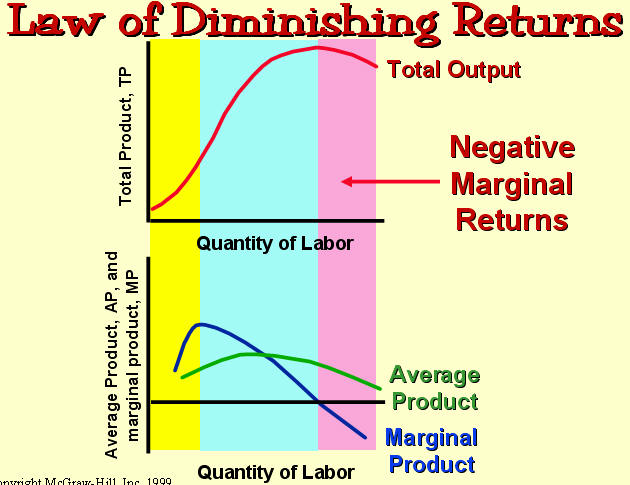
Marginal Returns - Increasing, Diminishing, and Negative: (click graphic for larger image)
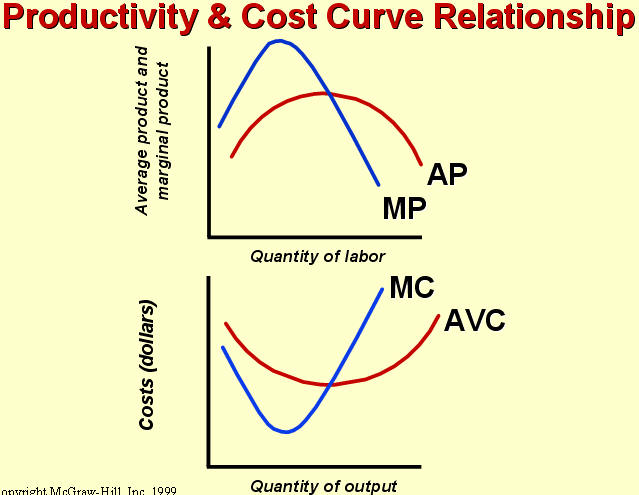
Production and Cost Curves Compared: (click graphic for larger image)
Pure Competition - characteristics (click graphic for larger image)

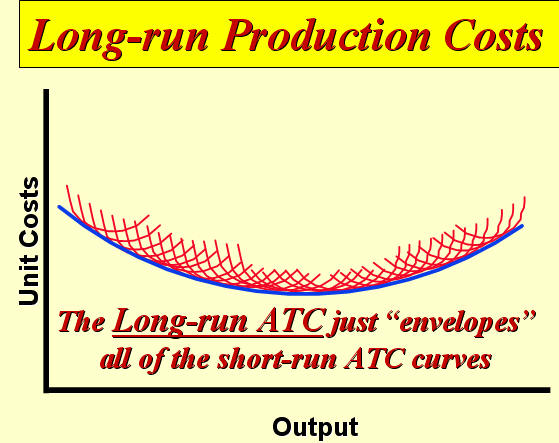
Short and Long Run Cost Curves Compared: (click graphic for larger image)
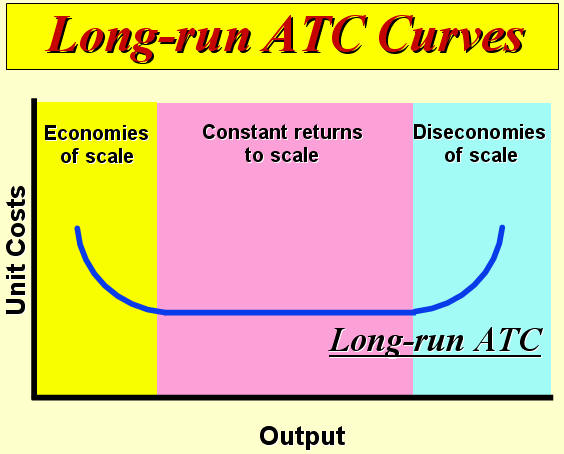
Economies, Diseconomies and Constant Returns to Scale: (click graphic for larger image)